Forex Trading with Fibonacci Calculator to Stay Ahead of the Curve
Fibonacci numbers were introduced to the European academic circle by an Italian mathematician named Leonardo Bigollo Pisano, better known as Fibonacci. He introduced the Indian numerical system in this famous book Liber Abaci (1202). However, the reason Forex traders are grateful to this mathematician is the amazing application of the Fibonacci sequence.
You can easily apply the Fibonacci sequence in Forex trading with the aid of our Fibonacci Calculator.
- What is Fibonacci?
- Why the Fibonacci Sequence is So Important in Trading Forex?
- Understanding the Concept of Self-Fulfilling Prophecy
- How to Use Fibonacci Formula in Forex Trading
- Why You Should Use ForexChurch Fibonacci Calculator in Forex Trading</li>
- How to Use ForexChurch Fibonacci Calculator in Forex Trading
What is Fibonacci?
The Fibonacci sequence is made up of a series of numbers where each number is the sum of two preceding numbers. While the Fibonacci sequence starts from 0, most academic books start the count from 1. However, in trading, the value of 0 is also important and we will discuss it later in the application of the sequence in trading.
Anyways, the Fibonacci formula is:
Fn = Fn-1 + Fn-2
So, if n = 1, the Fibonacci formula would formulate the following sequence of numbers:
1, 1, (1+1) 2, (1+2) 3, (2+3) 5, (3+5) 8, ... 13, 21, 34, 55, 89, 144... and so on.
Why the Fibonacci Sequence is So Important in Trading Forex?
The Fibonacci sequence, which is closely related to Golden ratio, is often found in nature and the concept still baffles scientists researching about natural phenomena, such as the evolution of species and plants. For example - to name a few - the Fibonacci sequence can be found in human faces, seed heads, flower petals, tree branches, spiral galaxies, and hurricanes.While using Fibonacci levels in trading is not a bulletproof system, the Fibonacci levels often become major support and resistance levels. And, when there is a confluence of Fibonacci levels with historical support and resistance, traders can utilize these levels to pinpoint where the price of a pair might stop and reverse. Furthermore, armed with the knowledge about where key Fibonacci levels are located, you can easily reduce your exposure to a trade or even look for reversal opportunities.
Understanding the Concept of Self-Fulfilling Prophecy
There is no scientific explanation behind this phenomenon, but the field of crowd psychology has offered some really good explanation about why the Fibonacci levels can suddenly become a very powerful tool in a Forex trader’s strategy toolbox.
The problem, which can become an opportunity if you know what you are doing, with the crowd or mass psychology is the herd behavior. When we are alone and have the time to analyze a situation, we tend to make more rational decisions in life. However, in a crowd, people tend to follow the direction of everyone else around them because that is how we, the human animals, have behaved for millennia-long before financial markets existed in the world.
Just like herds of sheep, bird flocks, and fish schools, we humans often let go of our cognitive abilities and rely on "groupthink" to make decisions - especially when there is not ample time to analyze the situation. The fear of losing out and the greed of making a quick buck often cloud our judgments and that's why trends exist. In finance, this is often manifested in the concept of extrapolation.
Nonetheless, the key reason Fibonacci sequence become important in trading is because of this herd behavior. Just imagine, if everyone is thinking that the 38.2% Fibonacci level has a confluence with 110.00 price level in EUR/USD in a certain situation, and all major hedge funds and institutional traders have put ample pending buy orders around this level, what will happen when the price drops and reaches this level? A flood of buy orders will be triggered and the falling EUR/USD will suddenly find ample support. Good enough to reverse the course of a major downtrend, right?
This is called a self-fulfilling prophecy. If the majority of the traders think the price of a currency pair will find ample support or resistance at a certain price level, the pending orders start building up. Just because everyone thinks a certain price level might have the potential to stop the trend, it ends up doing just that. That's why Fibonacci levels are so powerful in trading.
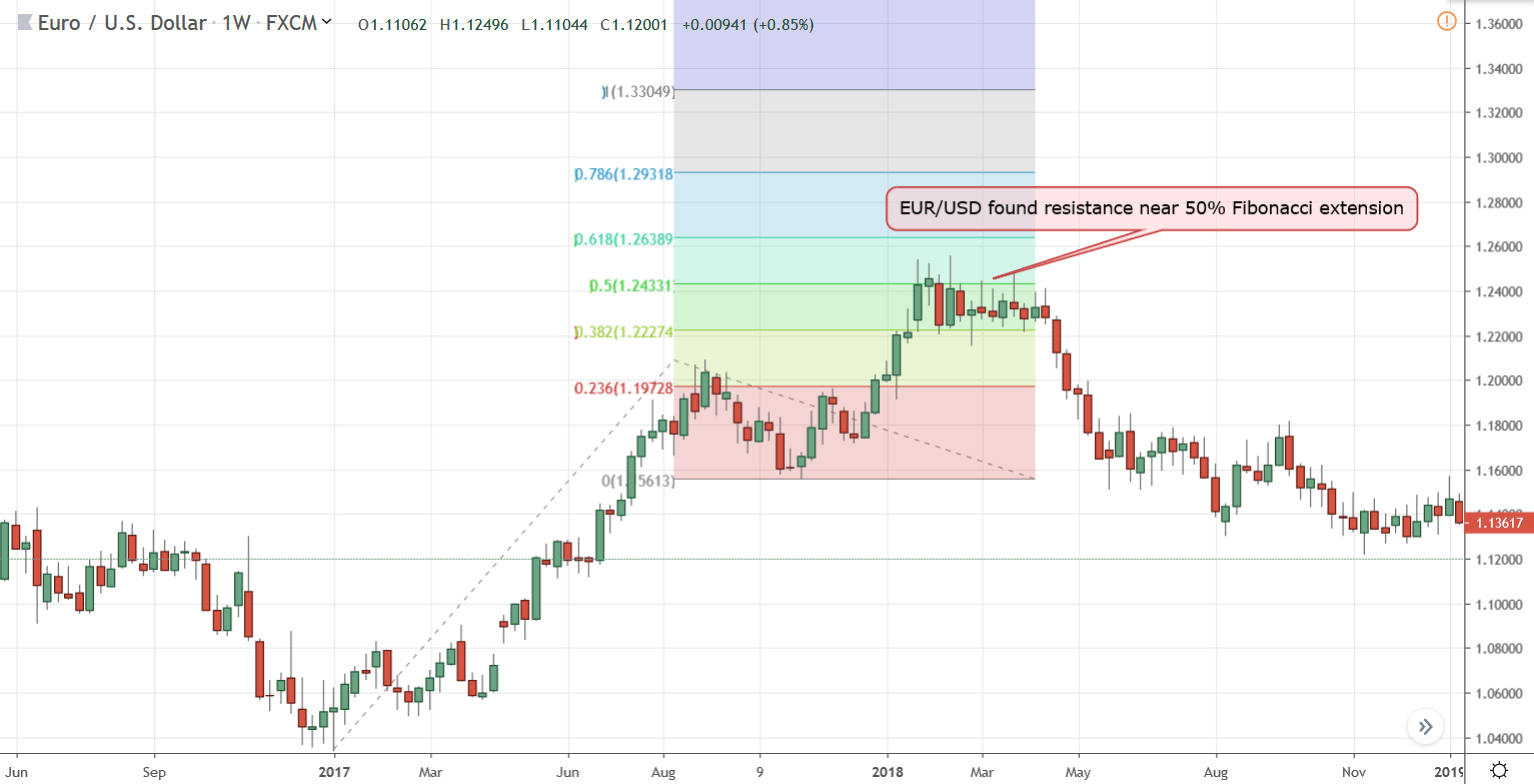
In figure 1, we have drawn the Fibonacci extension levels on a major uptrend's high and low, then completed applying the tool by connecting the low of the retracement. When the uptrend resumed, it went above the 0.5 Fibonacci extension level but failed to close above it. Soon, this major Fibonacci level turned into strong resistance and the uptrend reversed from here on. This is a perfect example of a self-fulfilling prophecy.
Furthermore, the 50% Fibonacci retracement level is not really a Fibonacci number. However, it is commonly used by Forex traders and added in the Fibonacci calculation because of the 50% principle in the Dow theory. This is another example of the self-fulfilling prophecy that despite not being a Fibonacci sequence number, the 50% level often becomes a major pivot zone just because enough traders consider this to be a major pivot zone under certain circumstances in the market.
How to Use Fibonacci Formula in Forex Trading
Most major technical charting software packages come with built-in tools for drawing Fibonacci levels. There are various ways you can apply the Fibonacci formula in Forex trading. In fact, traders have come up with a range of creative techniques. For example, there are Fibonacci Fans, Fibonacci Circles, Fibonacci Time Zone tools that are now basic features of any major reputable technical analysis platform. However, most traders start out using the Fibonacci formula by drawing either retracement levels or extension levels.
With Fibonacci retracement levels, traders wait for a major trend to start and then, wait some more for a retracement to happen. By connecting low to the high of the trend in an uptrend and high to low in a downtrend, Forex traders can plot Fibonacci retracement level on a chart. Then, traders try to predict at which level the retracement move might find support in an uptrend or resistance in a downtrend.
Armed with this prediction, traders can either blindly enter a trade or utilize other technical tools. Such as using an oscillator indicator like Stochastics to find overbought or oversold level during a retracement can help traders predict at which Fibonacci retracement level the currency pair might rebound and resume the dominant trend. However, the best way to play the Fibonacci retracement levels would be finding a confluence of several technical factors, such as existing historical support or resistance level coupled with a Fibonacci retracement level, where a technical trading strategy is producing a reversal of minor retracement signals.
By contrast, Fibonacci extension levels are used to anticipate where the price might stop after a trend finishes its retracement. Most technical analysis charting software's Fibonacci extension levels work similarly.
The way you plot these extension levels is, first find the low and high of an uptrend or the high and low of a downtrend. Then, wait for a bearish retracement to happen and bounce back to resume the original uptrend. After connecting the low and high in an uptrend, you drag the retracement level tool to the low of the retracement. Doing so will draw a bunch of Fibonacci levels above the highest high of the dominant uptrend, which will give you potential profit targets.
During a downtrend, first, you connect the high to low, then wait for the bullish retracement to end and the price of the currency pair to resume the downtrend. At this point, you plot the third point to the high of the retracement to get the Fibonacci extension levels, which will be drawn below the lowest low of the original downtrend. While there is no way to predict at which Fibonacci extension level the trend will ultimately stop, you can also use a confluence of historical support and resistance levels to confirm your profit target.
Hence, the best way to utilize the Fibonacci formula would be to combine both retracement levels and extension levels. Most professional Forex traders who regularly use the Fibonacci formula and sequence usually try to wait for a trend to establish then try to enter the market at a retracement level. Once the retracement ends, they set a stop-loss order below the low of the retracement in an uptrend or high of the retracement in a downtrend to protect their exposure in the market. Next, they will usually plot the Fibonacci extension level to see how far the trade might go in order to gauge a reasonable reward to risk ratio. Once the stop loss and potential profit target calculation offer a reasonable reward to risk ratio, they enter the trade.
Why You Should Use ForexChurch Fibonacci Calculator in Forex Trading
The ForexChurch Fibonacci Calculator lets you calculate both Fibonacci retracement and extension levels. While charting software will include some kind of Fibonacci tool, using the ForexChurch Fibonacci Calculator will help you accurately pinpoint each Fibonacci level. Since there is a certain margin of error in using graphical overlays to plot Fibonacci levels on a chart, using the web-based calculator will certainly provide more accuracy. Moreover, it will help you draw manual horizontal Fibonacci levels – only the levels you need instead of cluttering the chart with all the built-in Fibonacci levels.
How to Use ForexChurch Fibonacci Calculator in Forex Trading
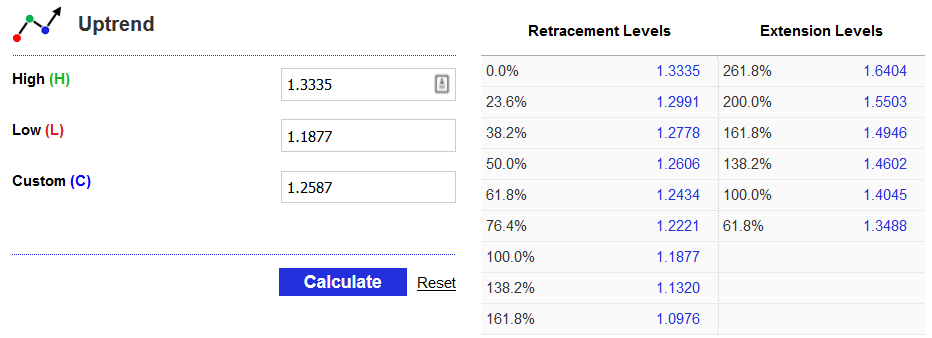
The web-based Fibonacci Calculator is rather easy to use once you understood the concepts of applying the Fibonacci sequence in Forex trading, which we already elaborately discussed above. There are two different Fibonacci Calculators, one for plotting Fibonacci levels during an uptrend and the other one is for the downtrend.
Regardless of which direction the market is going, there are only three key numbers you need to input in the Fibonacci Calculators in order to figure out all the major retracement and extension levels.
During an uptrend, once you are certain that a bearish retracement has begun, just input the lowest value of the bar that started the uptrend in Low (L) field and the highest value of the bar that ended the given uptrend in the High (H) field.
Now, you can click on the blue "Calculate" button to find out the Fibonacci retracement levels and plan to enter the market near a certain level based on your trading strategy.
Once you are certain that the bearish retracement is over and the price has resumed the original uptrend, input the lowest value of the bar which reversed and resumed the uptrend in the Custom (C) field. Then click on "Calculate" again to find the Fibonacci extension levels that you should aim to take some profits out of the trade or close the trade entirely, depending on your money management strategy.
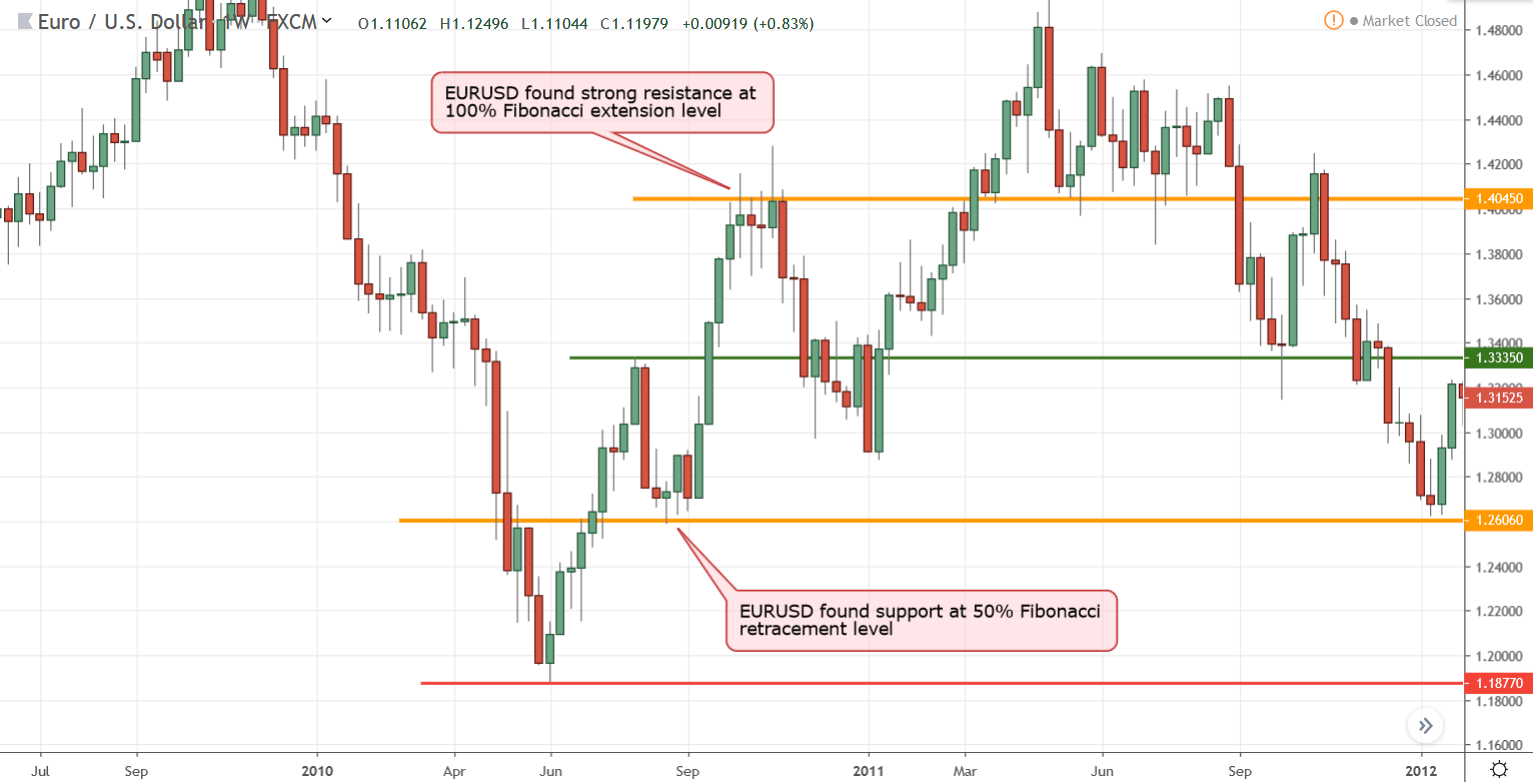
In figure 3, we can see the plotted the 50% Fibonacci retracement level seen in figure 2, where the EURUSD found support during a bearish retracement and reversed. We can also see that after reaching the 100% Fibonacci extension level, the EURUSD uptrend found major resistance and failed to close above this level. After several tries, the bulls gave up and the uptrend ended.
Using the ForexChurch Fibonacci Calculator, you could have easily predicted where the bearish retracement might find support and where the uptrend would likely end way before it actually happened and plan your trade around the forecast.
Now, let's see how you can use the ForexChurch Fibonacci Calculator during a downtrend.
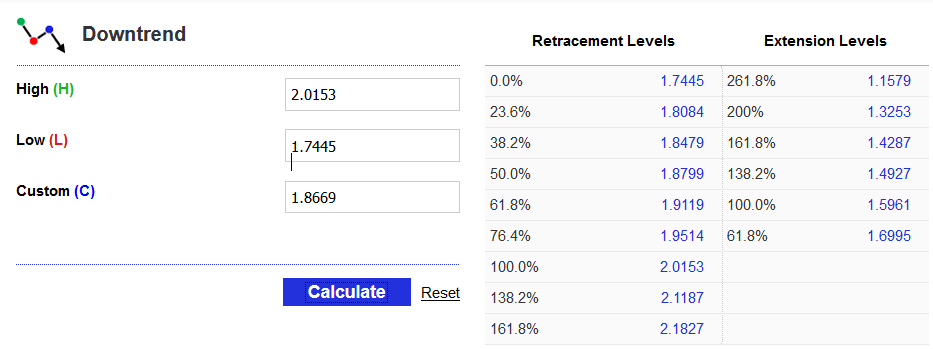
During a downtrend, once you see that a bullish retracement has begun, just input the highest value of the bar that started the uptrend in High (H) field and the lowest value of the bar that ended the given downtrend in the Low (L) field.
Then, once you click on the "Calculate" button, it will show you the Fibonacci retracement levels where the bullish retracement may find strong resistance. With this predictive capability, you can plan to enter the market near a certain level based on your trading strategy.
Once the bullish retracement is over and the price has resumed the original downtrend, input the highest value of the bar which reversed and resumed the downtrend in the Custom (C) field. Then click on "Calculate" again to find the Fibonacci extension levels. There is no surefire way to know at which Fibonacci extension level the downtrend will end. However, if you follow your trading strategy that has some sort technique to follow a trend, like a two-bar stop loss method, you will be able to keep the bulk of the movement from the trend as your profit.
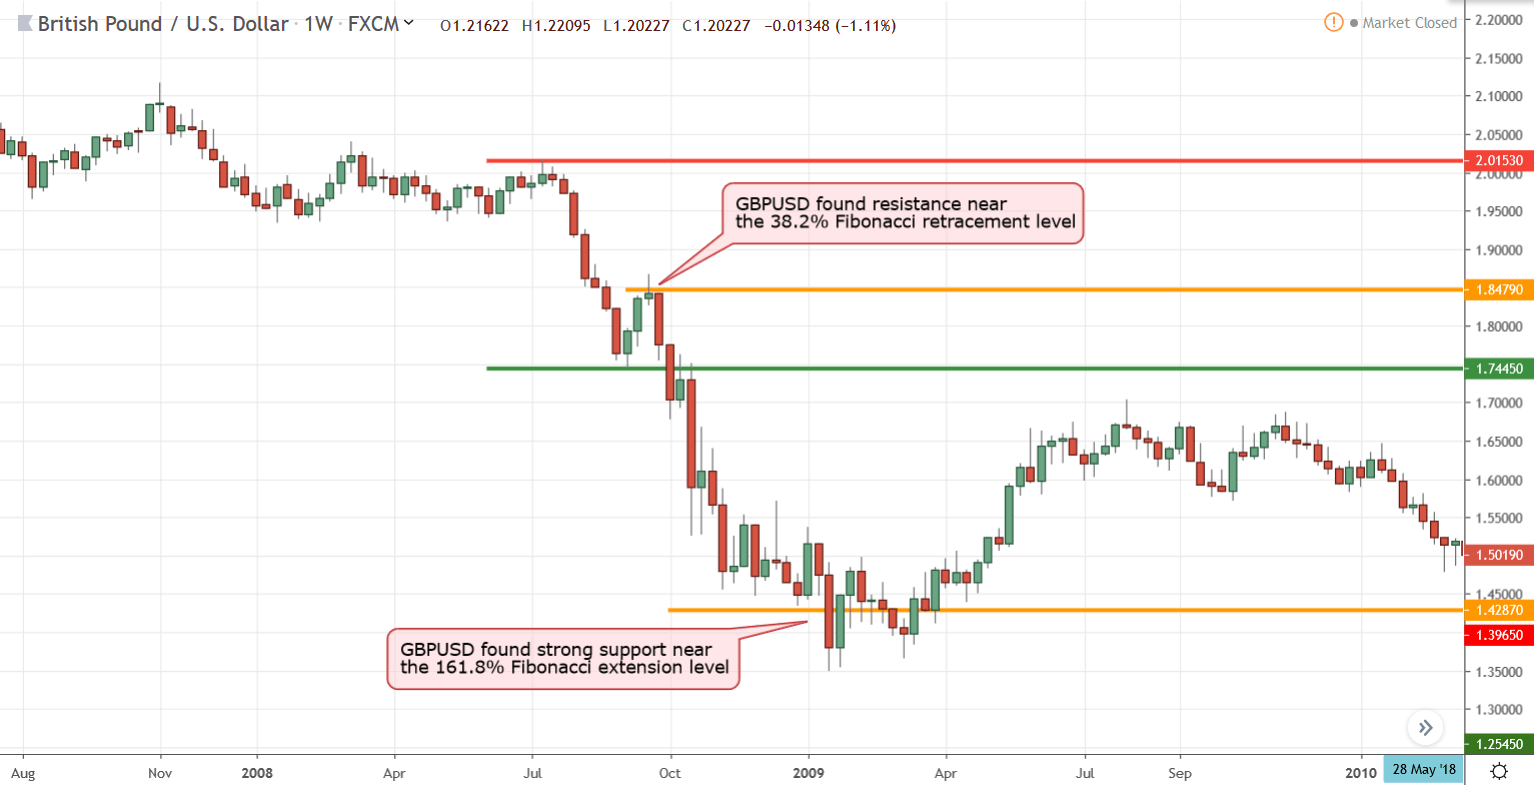
In figure 5, we have plotted the high and low of the GBPUSD downtrend that we calculated in figure 4. As you can see, the bullish retracement found a strong resistance near the 38.2% Fibonacci retracement level at 1.8479. Once the downtrend resumed, it gained bearish momentum and fell to the 161.8% Fibonacci extension level at 1.4287, which we calculated based on the high of the retracement at 1.8669.
The Bottom Line
Trading Fibonacci retracement and extension levels with the aid of the ForexChurch Fibonacci Calculator is a great way to add a predictive capability to your trading strategy. However, keep in mind that simply knowing where a retracement might resume the trend or how far the trend will go once will not magically make you a better trader.
The key to using the powerful Fibonacci sequence in Forex trading is combining it with a trading strategy that can accommodate the forecast generated by these predictive levels. For example, if you do not have a reliable entry method when the price of a currency pair finishes its retracement and about to resume the predominant trend, regardless how well prepared you are to enter the market at certain Fibonacci retracement levels, your overall strategy will not work.
Some traders blindly enter the market at 38.2% or 61.8% Fibonacci retracement levels to maximize their reward to risk ratio. This strategy may be further improved if you combine price action patterns like looking for pin bars or engulfing bars near major Fibonacci retracement levels.
Furthermore, success in trading Forex is heavily dependent on money management rules. When looking for potential profit targets, your Forex trading strategy should have clear and written rules about under what circumstances you would close your trade without jeopardizing your trade by getting out of the market too soon and leaving potential profits on the table.


